← All projects

Project 02 · Duke Aeroelasticity Group · May 2026 – Present

Folded Wingtip Aeroelasticity: Modal Analysis and Coupled-Mode Classification

Finite element modal analysis of folded wingtip configurations in ANSYS, benchmarked against Euler-Bernoulli and Saint-Venant theory and prior hammer-testing data, and the instrumentation blind spot that comparison exposed.

Role
Undergraduate researcher
Advisor
Prof. Earl Dowell
Timeline
May 2026 – Present
Status
Ongoing
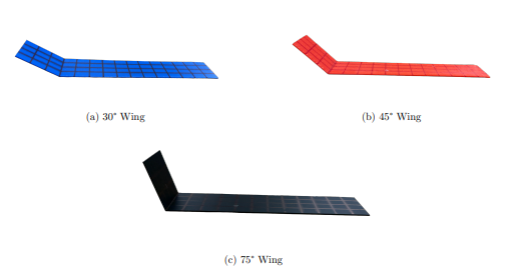
PLA wing models at several wingtip fold angles
FIG. 01PLA wing models, representative fold angles
01
Overview

How wingtip folding changes a wing's bending and torsion modes, and what the physical experiment was never able to see.

What began as a benchmarking exercise turned into understanding a structural blind spot in the experimental setup itself.

I performed modal analysis on a flat wing with a folded wingtip in ANSYS. The original goal was to find the natural bending and torsion modes for wings across a range of wingtip fold angles and compare them against analytical predictions for a flat wing with no wingtip, Euler-Bernoulli for the bending modes and Saint-Venant torsion for the torsional ones, as well as hammer-testing results collected earlier in the semester. During that comparison, the benchmark flat wing showed a chordwise (in-plane) bending mode in the FEA that hammer testing had never captured, as the original accelerometers weren't oriented to detect in-plane motion. That same blind spot turned out to matter far more once the wingtip was folded, as the folded-wingtip configurations' torsional modes were themselves coupled with in-plane bending, which the hammer test setup was incapable of capturing from the start.

0–90°
Fold angle range
Sweep increment
12
Modes per case
3
Classification methods
Specimen
PLA wing, 0.30 × 0.05 × 0.00158 m
Baseline
Flat (0°) wing — first 4 flapwise bending and first 3 torsion frequencies, derived analytically
MAC threshold
≈ 0.93 for confidently calling a mode bending-dominant
02
What I did

The baseline first, then the fold sweep, and then the modal classifications.

From learning the basics to understanding the complexities within coupled modes.

01

Established an analytical baseline for the flat (0°) wing by finding the first 4 flapwise bending frequencies from Euler-Bernoulli beam theory and the first 3 torsion frequencies from Saint-Venant torsion using the wing's measured geometry (0.30 × 0.05 × 0.00158 m) and PLA material properties.

02

Built a solid-geometry model of the benchmark flat wing in ANSYS DesignModeler and ran modal analysis to compare against both the analytical baseline and prior hammer-testing data, and found a chordwise (in-plane) bending mode in the FEA that the hammer test had never captured, because its accelerometers weren't oriented to detect in-plane motion.

03

Applied that finding to the folded-wingtip configurations and discovered their torsional modes were themselves coupled with in-plane bending, which the hammer test setup was structurally blind to for the same reason.

04

Built solid-geometry models for fold angles of 0°, 15°, 30°, and 45°, running modal analysis with Tet10 solid elements across five mesh sizes to check convergence and extracting the first 12 natural frequencies per case.

05

Expanded the study to the full 0–90° range in 5° increments, comparing computed results against both the analytical baseline and prior experimental data.

06

Fixed a mode-tracking problem: at certain fold angles, adjacent frequencies got close enough that mode shapes swapped which mode number they were assigned, producing discontinuous trend lines. Regrouping results by mode shape character instead of raw mode number resolved it.

07

Diagnosed a meshing limitation in the solid-element model and rebuilt it around a 2D mid-surface shell geometry with SHELL181 elements and an explicit thickness assignment.

08

Developed and cross-validated three independent comparison methods: a deformation ratio method, an effective mass ratio method, and a Modal Assurance Criterion (MAC) comparison against the flat-wing baseline. These were used for classifying coupled modes as torsion- or bending-dominant.

09

Currently verifying mode-shape orthogonality via MAC cross-checks between solver runs, and preparing to rerun hammer testing with chordwise-oriented accelerometers added.

FIG. 02Mode 7, 45° fold — deformation animated
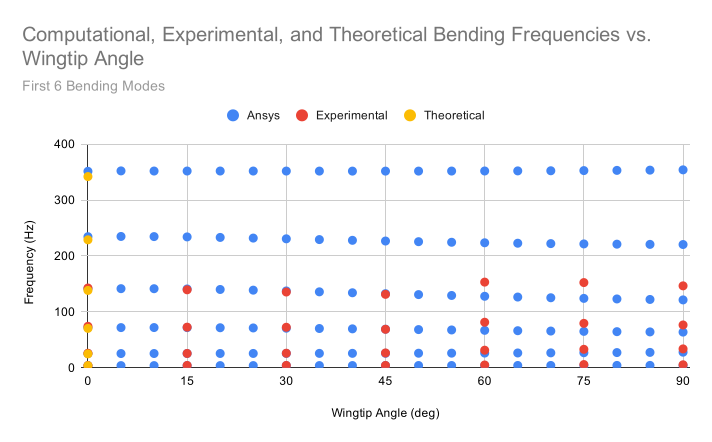
Bending frequencies against wingtip fold angle, comparing computational, experimental and theoretical results.
FIG. 03Bending frequencies vs. wingtip angle — computational, experimental, theoretical
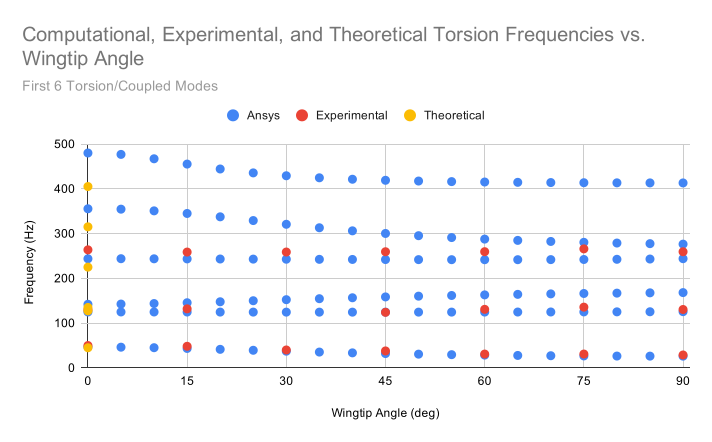
Torsion frequencies against wingtip fold angle, comparing computational, experimental and theoretical results.
FIG. 04Torsion frequencies vs. wingtip angle — computational, experimental, theoretical
03
Tools & methods

The tools that carried the research.

The learning equally surrounded the use of various tools and methods as it did the theoretical and experimental aspects.

Software
ANSYS DesignModeler & Mechanical
Elements
Tet10 solid elements initially; rebuilt around SHELL181 (QuadShell4) shell elements on a mid-surface model
Analytical benchmark
Euler-Bernoulli beam theory (flapwise bending) and Saint-Venant torsion, unrestrained warping (torsion)
Classification
Three independent, cross-validated methods: deformation ratio (Y- vs. Z-direction directional deformation), effective mass ratio (chordwise vs. torsional effective mass), and MAC against the flat-wing baseline
Physical testing
Hammer (impact) testing — original data collected without observing chordwise motion; preparing to retest with accelerometers in the proper orientation
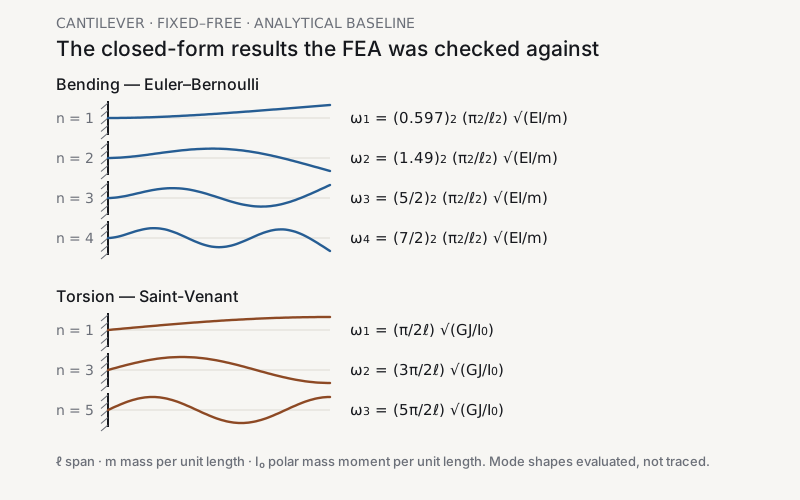
Closed-form fixed-free cantilever results. Four bending mode shapes with frequencies from the Euler-Bernoulli roots, coefficients 0.597, 1.49, 5/2 and 7/2; three torsion mode shapes at n of 1, 3 and 5 with frequencies n pi over twice the span.
FIG. 05Analytical baseline — cantilever bending and torsion, redrawn
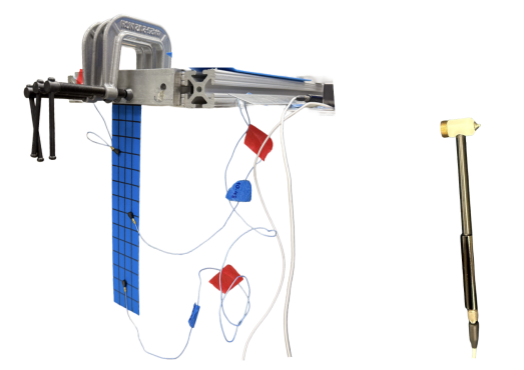
Hammer testing setup with accelerometers mounted on the wing
FIG. 06Hammer test setup
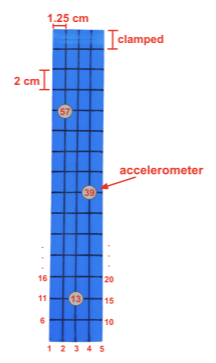
Diagram of the hammer testing configuration and measurement axes
FIG. 07Measurement axes
04
What went wrong

Flaws that became apparent as the analysis was carried out.

None of these announced themselves. Each one was found by checking results against something independent that should have agreed with it.

Failure 01Element formulation

Solid elements couldn't hold a consistent mesh through the wing's thickness

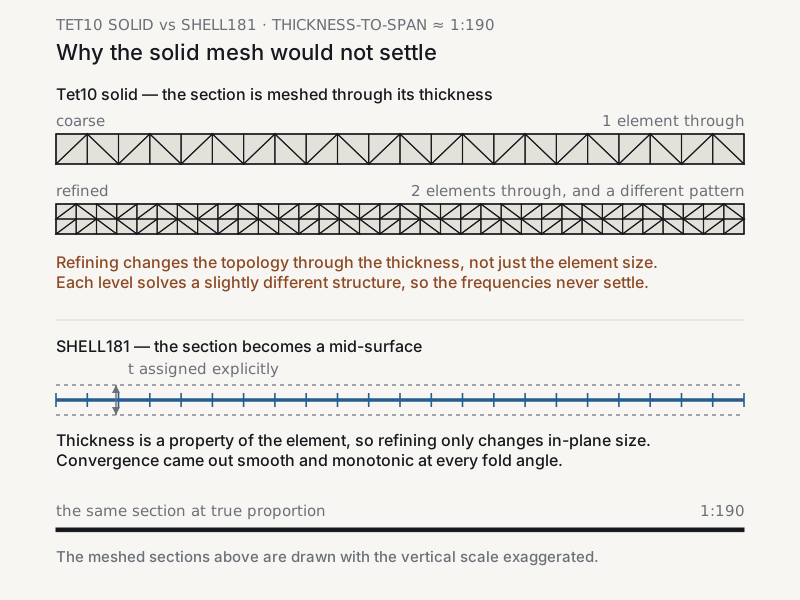
The wing has a thickness-to-span ratio of roughly 1:190, and the Tet10 solid elements were too large relative to that thickness to maintain a consistent mesh topology as element size changed. Different refinement levels produced different mesh patterns through the thickness, which showed up as irregular and unreliable frequency convergence.

The fix

I replaced the solid geometry with a 2D mid-surface shell model (SHELL181 elements, explicit thickness assignment) which is the industry-standard approach for thin-plate structures, which eliminated the inconsistency and produced smooth, monotonic convergence across every configuration.
Failure 02Mode classification

My first classification method misclassified the lowest coupled mode

The deformation ratio method compared Y-direction (torsion) to Z-direction (in-plane bending) deformation to classify each mode. For the first torsion-bending coupled mode, though, the folded tip's apparent chordwise motion turned out to be a rigid-body-like translation caused by the torsional rotation itself, not independent bending. The ratio method couldn't tell the two apart, so it mislabeled a torsion-dominant mode as bending-dominant.

The fix

I caught this by developing two further, independent classification methods (effective mass ratio and MAC against the flat-wing baseline) and cross-validating all three against direct visual inspection of the mode shapes, which converged on a reliable MAC threshold (≈ 0.93) for confidently calling a mode bending-dominant.

Failure 03Data processing

Sorting by mode number produced misleading trends

At several fold angles, two frequencies passed close enough to each other that their mode shapes swapped which mode number they were assigned, so plotting by raw mode number gave discontinuous, irregular trend lines.

The fix

Regrouping by mode shape character instead of mode number solved it.

Failure 04Experimental setup

The original hammer testing had a blind spot that only became visible by comparing it against FEA

Comparing the benchmark flat wing's FEA results against earlier hammer-testing data showed a chordwise (in-plane) bending mode that the experiment had never captured, since its accelerometers weren't oriented to detect in-plane motion. That same gap mattered far more once I checked the folded-wingtip configurations, as their torsional modes turned out to be coupled with in-plane bending, which resulted in discrepancies between experimental, analytical, and computational results.

The fix — in progress

I'm currently learning proper hammer-testing procedure and preparing to rerun select test cases with chordwise-oriented accelerometers added to directly capture the motion that the original setup missed.

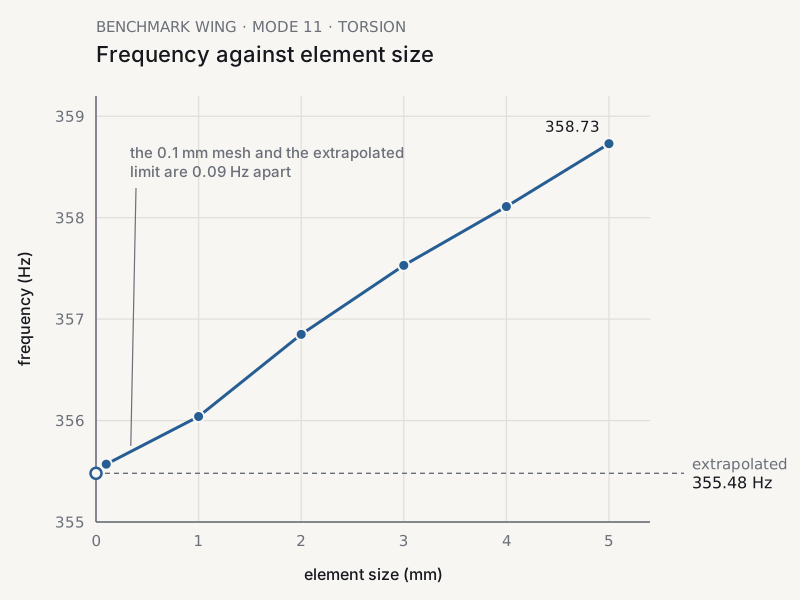
Mode 11 torsion frequency of the benchmark wing against element size, falling from 358.73 Hz at 5 mm to 355.57 Hz at 0.1 mm and converging on an extrapolated 355.48 Hz.
FIG. 08Failure 01 — convergence once the mesh was consistent
At a thickness-to-span ratio near 1:190, a coarse Tet10 mesh fits one element through the section and a refined mesh fits two in a different pattern, so each refinement solves a slightly different structure. A SHELL181 mid-surface makes thickness a property instead, so refinement changes only in-plane size.
FIG. 09Failure 01 — solid mesh against a shell mid-surface
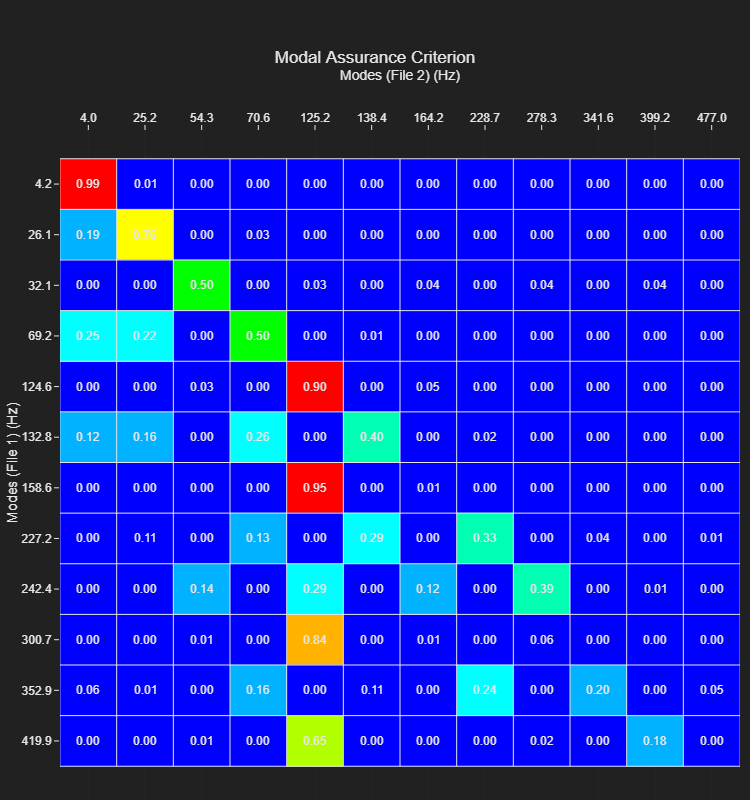
Modal Assurance Criterion matrix, 45-degree folded wing against the flat benchmark. Strong diagonal terms at the low modes fall away higher up, with off-diagonal pairings showing modes that have swapped order or coupled.
FIG. 10Failure 02 — MAC, 45° against flat baseline
05
What I learned

Three things I'd check earlier next time.

01

A blind spot found on the simplest case is worth checking against the complex one before assuming it's a minor detail. The missing chordwise mode on the flat-wing benchmark looked like a small experimental gap on its own, but turned out to be the key to understanding why the folded-wingtip modes were coupled at all.

02

Element formulation has to match the actual geometry, not just look reasonable at a glance. Solid elements seemed fine until convergence was attempted, where trends were variable and unreliable. The issue was understood when learning about the mid-surface shell approach for thin plates, which is the industry standard for analyses like these.

03

A classification method can look right almost everywhere and still be systematically wrong in a way that's invisible until you check it against something independent. The deformation ratio method wasn't necessarily broken, it just took two more methods and a visual cross-check to understand where it was falling short.

06
Next steps

Finish up current analysis work, then go back to the original test.

Finish verifying mode-shape orthogonality via MAC cross-checks between solver runs, confirming no unintended coupling or duplication from the solver or post-processing pipeline.
Complete hammer-testing training and rerun select test cases with chordwise accelerometers added, to directly capture the coupled modes the original experimental setup couldn't detect.
Apply the finalized three-method classification framework across the full 0–90° dataset.
Begin learning about and preparing for further experiments with flutter analysis to truly understand the dynamic stability under aerodynamic loads.